Loaning data combined with sum and cdef
Different arithmetic operations may be combined to create the graphs you want. Insert appropriate lines in the Munin Master configuration file munin.conf.
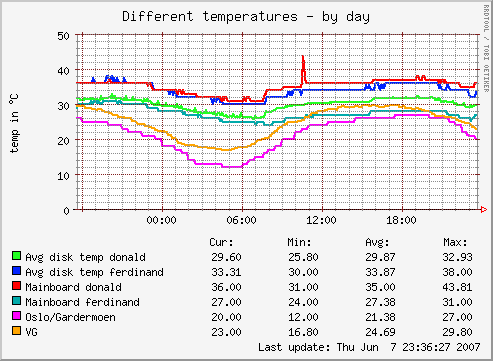
The first example shows how to create a graph by loaning data from other sources, then adding an average value from five other data sources using sum and cdef. The data in the example uses the following types of temperature measurements
- Disk temperatures from S.M.A.R.T. readouts from servers called donald and ferdinand (lines 06, 07)
- Motherboard temperatures from
sensorsreadouts from the same servers (lines 08, 09)- weather.com reading from Oslo airport, Gardermoen (line 10)
- A regular temperature sensor (line 11)
Line 06 is only a placeholder, which will be populated later by using sum and cdef.
01     temperatures.update no
02     temperatures.graph_args --base 1000 -l 0
03     temperatures.graph_category Sensors
04     temperatures.graph_title Different temperatures
05     temperatures.graph_order \
06             donald_disk \
07             ferdinand_disk=ferdinand.example.com:hddtemp_smartctl.sda \
08             donald_mb=donald.example.com:sensors_temp.temp1 \
09             ferdinand_mb=ferdinand.example.com:sensors_temp.temp1 \
10             gardermoen=ferdinand.example.com:temperatures.ENGM \
11             VG=donald.example.com:munintemp.vg
12     temperatures.donald_disk.sum \
13             donald.example.com:hddtemp_smartctl.sda \
14             donald.example.com:hddtemp_smartctl.sdb \
15             donald.example.com:hddtemp_smartctl.sdc \
16             donald.example.com:hddtemp_smartctl.sdd \
17             donald.example.com:hddtemp_smartctl.sde
18     temperatures.donald_disk.cdef donald_disk,5,/
19     temperatures.VG.label VG
20     temperatures.donald_mb.label Mainboard donald
21     temperatures.ferdinand_mb.label Mainboard ferdinand
22     temperatures.gardermoen.label Oslo/Gardermoen
23     temperatures.ferdinand_disk.label Avg disk temp ferdinand
24     temperatures.donald_disk.label Avg disk temp donald
Explanations, per line
- 01 - 04: The usual headers
- 05 - 11: Defines the graph order, where 5 out of 6 data sources are borrowed elsewhere Note: Line 11 defines a not yet “populated” data source.
- 12 - 17: Sums 5 other data sources (temperatures from 5 disks), into the “donald_disk” data source
- 18: Divides the “donald_disk” data source by the number of sources (5) to create an average
- 19 - 24: Labels to make it all look neat
This produces a pretty graph like this, to show the relation between outside temperatures and disk/mainboard temperatures:
Further reading
- Graph aggregation by example
- Graph aggregation stacking example
- munin.conf directives explained