Graph aggregation stacking example
Here we show how to create a stacked graph with data sources from multiple nodes.
Plugin involved
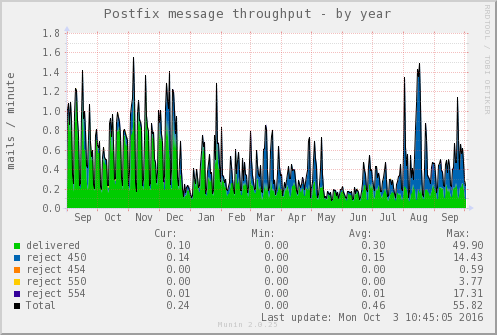
The example uses a plugin that monitors Postfix message throughput.
Let’s first look at its config output:
# munin-run postfix_mailstats config
graph_title Postfix message throughput
graph_args --base 1000 -l 0
graph_vlabel mails / ${graph_period}
graph_scale  no
graph_total  Total
graph_category postfix
graph_period minute
delivered.label delivered
delivered.type DERIVE
delivered.draw AREA
delivered.min 0
r450.label reject 450
r450.type DERIVE
r450.draw STACK
r450.min 0
r454.label reject 454
r454.type DERIVE
r454.draw STACK
r454.min 0
r550.label reject 550
r550.type DERIVE
r550.draw STACK
r550.min 0
r554.label reject 554
r554.type DERIVE
r554.draw STACK
r554.min 0
Extract from munin.conf
The following extract from munin.conf is explained in detail, step by step, below the configuration.
1 [foo.example.com]
2 address ..
3
4 [bar.example.com]
5 address ..
6
7 [baz.example.com]
8 address ..
9
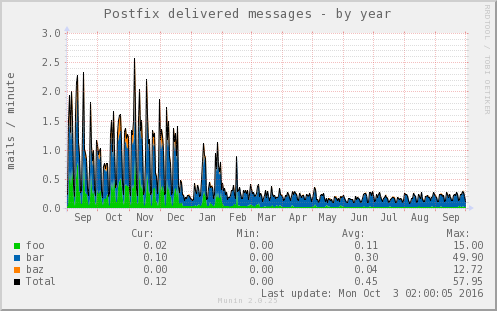
10 [aggregates.example.com]
11 update no
12 contacts none
13
14 # This graph stacks the number of postfix delivered mails / minute
15 # from the nodes foo.example.com, bar.example.com and baz.example.com
16
17 total_mailstats.update no
18 total_mailstats.graph_args --base 1000 -l 0
19 total_mailstats.graph_category postfix
20 total_mailstats.graph_period minute
21 total_mailstats.graph_title Postfix delivered messages
22 total_mailstats.graph_vlabel mails / ${graph_period}
23 total_mailstats.graph_scale no
24 total_mailstats.graph_total Total
25 total_mailstats.total_delivered.label not_used
26 total_mailstats.total_delivered.type DERIVE
27 total_mailstats.total_delivered.draw AREA
28 total_mailstats.total_delivered.min 0
29 total_mailstats.total_delivered.stack \
30 foo=Infrastruktur;foo.example.com:postfix_mailstats.delivered \
31 bar=Infrastruktur;bar.example.com:postfix_mailstats.delivered \
32 baz=Infrastruktur;baz.example.com:postfix_mailstats.delivered
Explanations, per line
- 1 - 2: Configuration of Node foo.example.com.
- 4 - 5: Configuration of Node bar.example.com.
- 7 - 8: Configuration of Node bar.example.com.
- 10: Define the name of the virtual node. The name of a node group can optionally be added here, e.g. “[Virtual; aggregates.example.com]”.
- 11: Make sure that
munin-updatedoes not try to actively gather information for this node. - 12: Tell
munin-limitsnot to send alerts if any limit is breached.
The above lines (1 - 12) have now established the fundament for four
nodes in the Munin tree; three real nodes delivering data on connect
by munin-update and one virtual node for the aggregate graphs.
- 17: No fetch from node should be done for this virtual plugin (which is named implicitly herewith to “total_mailstats”).
- 18 - 24: Define the virtual plugin’s config in the same way as
set for its ancestor plugin
postfix_mailstats(see output in section Plugin involved above). We set a different graph title though, as we graph only fielddeliveredhere. - 25: The virtual plugin’s field itself will not show up in the graph but only the fields loaned from the real nodes. Therefore this hint that will be shown in the graphs legend.
- 26: Default type is
GAUGEbut we have typeDERIVEhere. So the field’s type has to be declared explicitly. - 27: Values should be drawn as AREA and not as LINE for better recognition of small values.
- 28: Cut off negative values which can arise at arithmetic overflow for data type
DERIVE. See manual of rrdgraph - 29: This directive is the key that opens the door for
loaning data sources from other nodes and plugins.
As we choose option
stackhere, the values of the hereafter referenced data sources will show up stacked on each other in the graph. - 30 - 33: Declare the virtual data fields as reference to the original data source in node foo, bar and baz. The string on the left side of the expression will be the name of the data field shown in the graph of this virtual plugin. Hint: If you need to reference a node that is member of a node group, then enter its name with the leading group name like “Group;node.name”.
Further reading
- Graph aggregation by example
- munin.conf directives explained